Chapter 5 Results
We finally reach the stage where we will be performing the actual analysis and solve the questions we presented in the Problem Statement at the start. We have divided this analysis into three broader segments and will be presenting objectives and outputs as we go along.
5.1 Analysis of Repetitive Patterns
Let us start the analysis by studying the overall global picture that the coronavirus painted across all major stock markets. In the analysis below, we study about seven equity markets spread on the globe.
- FTSE (London, United Kingdom) - The Financial Times Stock Exchange 100 Index, also called the FTSE 100 Index, FTSE 100, FTSE, or, informally, the “Footsie”, is a share index of the 100 companies listed on the London Stock Exchange with the highest market capitalisation.
- DAX (Frankfurt, Germany) - The DAX is a representation of the German (Frankfurt) Stock Exchange consisting majorly of the Bluechip organizations trading in Germany.
- FEZ (Europe on New York Stock Exchange) - The FEX equity holds European stocks on the NYSE. This is, therefore, a unique equity to understand since it functions on cross-market sentiments.
- 000001.SS - SSE Composite Index (Shanghai, China) - The SSE index is a representation of the Shanghai Stock Exchange and trades equities in the Chinese markets.
- IXIC - Nasdaq Composit (United States) - The Nasdaq Composite is a stock market index that includes almost all stocks listed on the Nasdaq stock exchange. Along with the Dow Jones Industrial Average and S&P 500, it is one of the three most-followed stock market indices in the United States.
- DJI (United States) - Dow Jones Industrial Average
- N225 - Nikkei (Tokyo, Japan) - The Nikkei 225, or the Nikkei Stock Average, more commonly called the Nikkei or the Nikkei index, is a stock market index for the Tokyo Stock Exchange.
Key Observations from the analysis of Global Markets:
- The foremost observation this graph gives us is the sudden fall in returns in April 2020. This was one of the biggest falls in US and the gloab Stock Market History and came just the day after WHO announced COVID-19 as a global pandemic.
- Again, in December 2020 - January 2021 we see a sudden high upside in all the returns. This was the moment when pharmaceuticals in Russia and the United States had announced their progress of vaccine programs.
- A common and not-so-expected trend we see is that all the major global markets followed the same trend throughout COVID-19. The same degree of fall and rise on all accounts. A question arises here, are all global markets always (regardless of any events) follow similar patterns of growth and demand?
Day Trade Patterns during the announcement of the Covid Outbreak and Vaccine Availability
Let us now look at the trading prices of some diversified sectors of economy to understand if we see any important patterns of data.
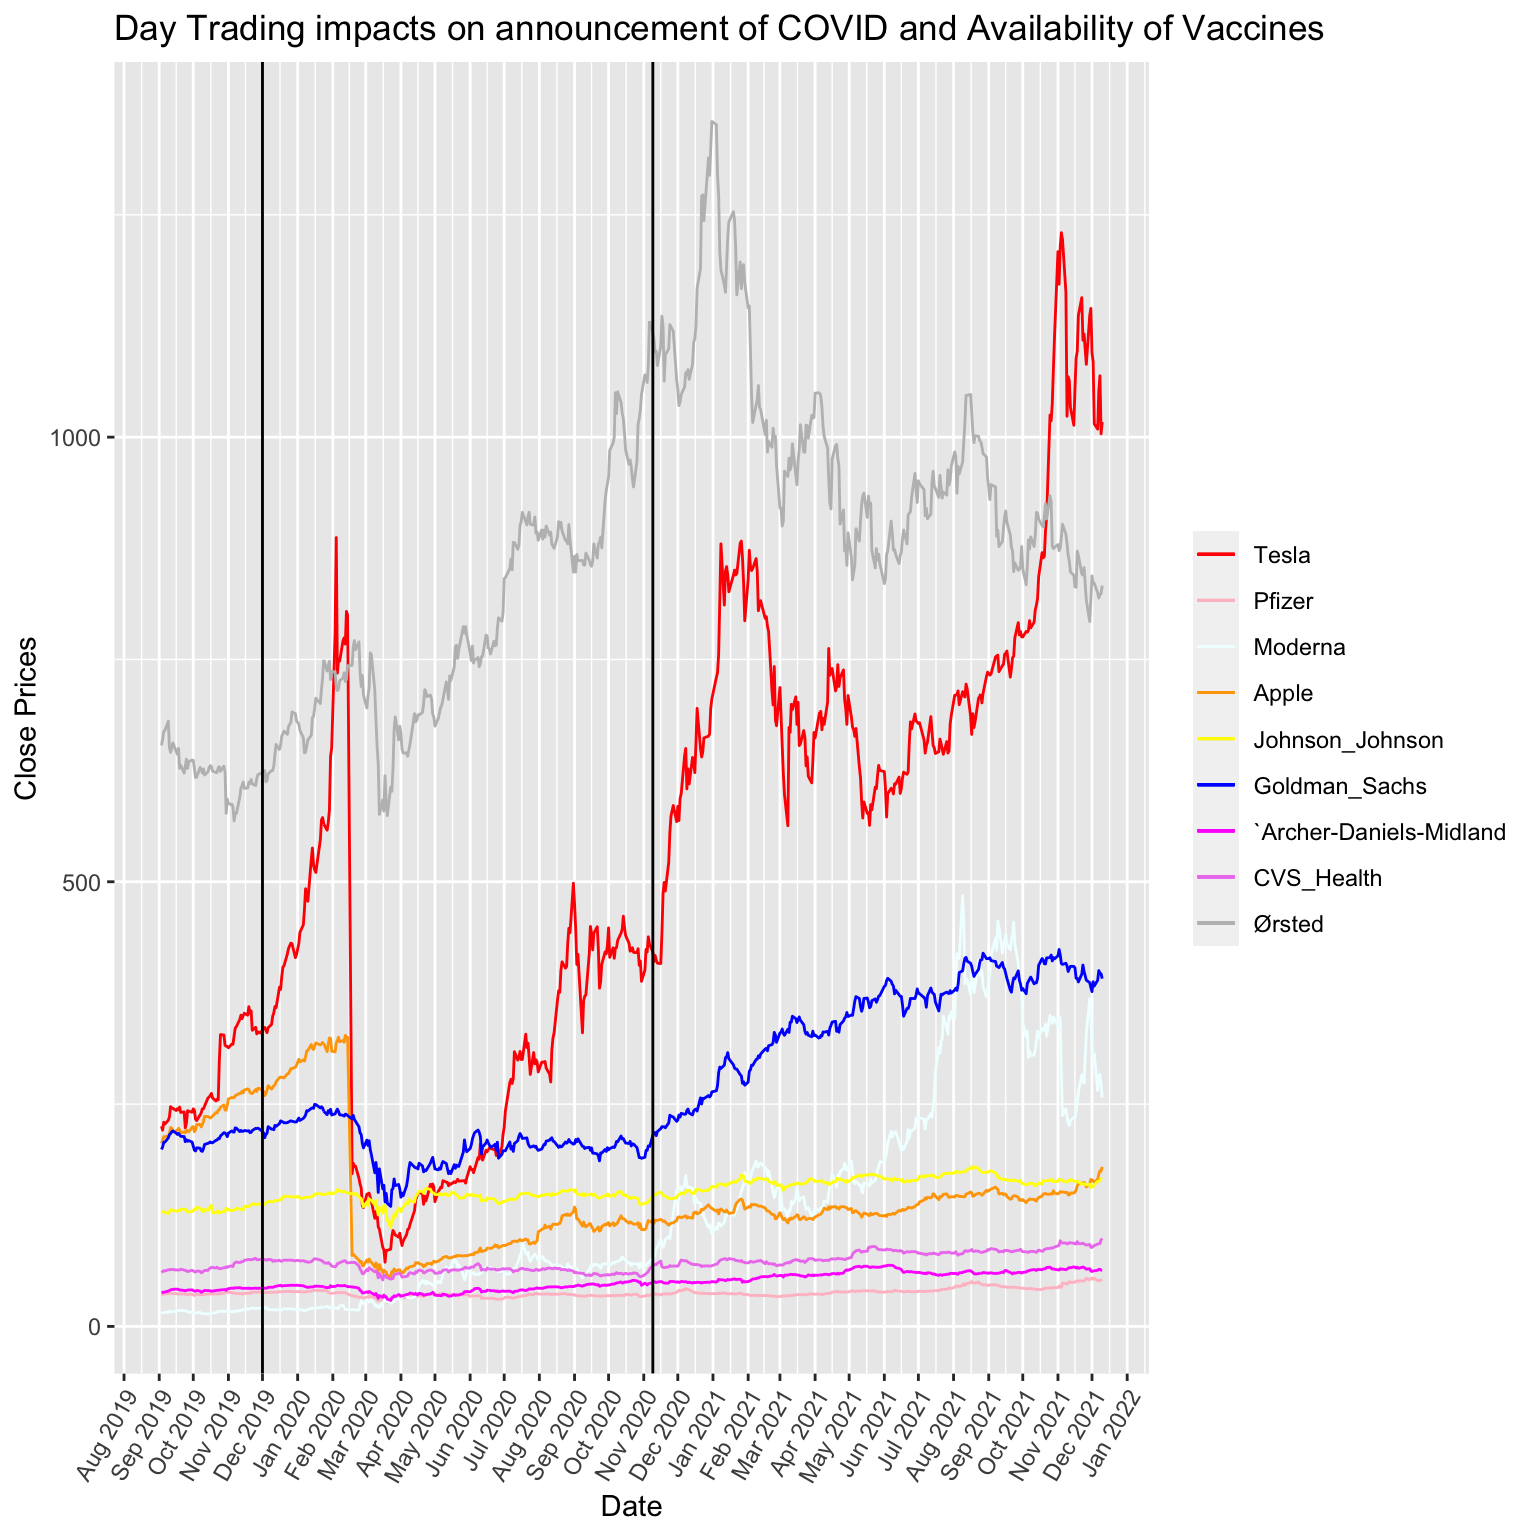
Key Observations from the analysis of Global Markets:
- The first observation from this analysis is that the performance of organizations did not get affected by the advent of the virus starting to spread in China, which is represented by the first black verticle line.
- The steep decline only started after WHO officially declared COVID-19 a pandemic in March 2020. This stands with the observation we made above.
- The second black vertical represents the annoucement of vaccine preparation and despatch and we see a rise soon after that point in almost all the stocks.
- A surprising note is that Johnson & Johnson and Pfizer stayed constant throughout COVID-19 despite all the news. It explains that the investor’s sentiment did not align with vaccine news.
5.2 Behavioural Stock Price Analytics during COVID-19
One metric that helps us understand the behaviour of investing is the number of trades being executed during day trades. The trade volume for all the stocks will tell us if trade executions increased post some key announcements.
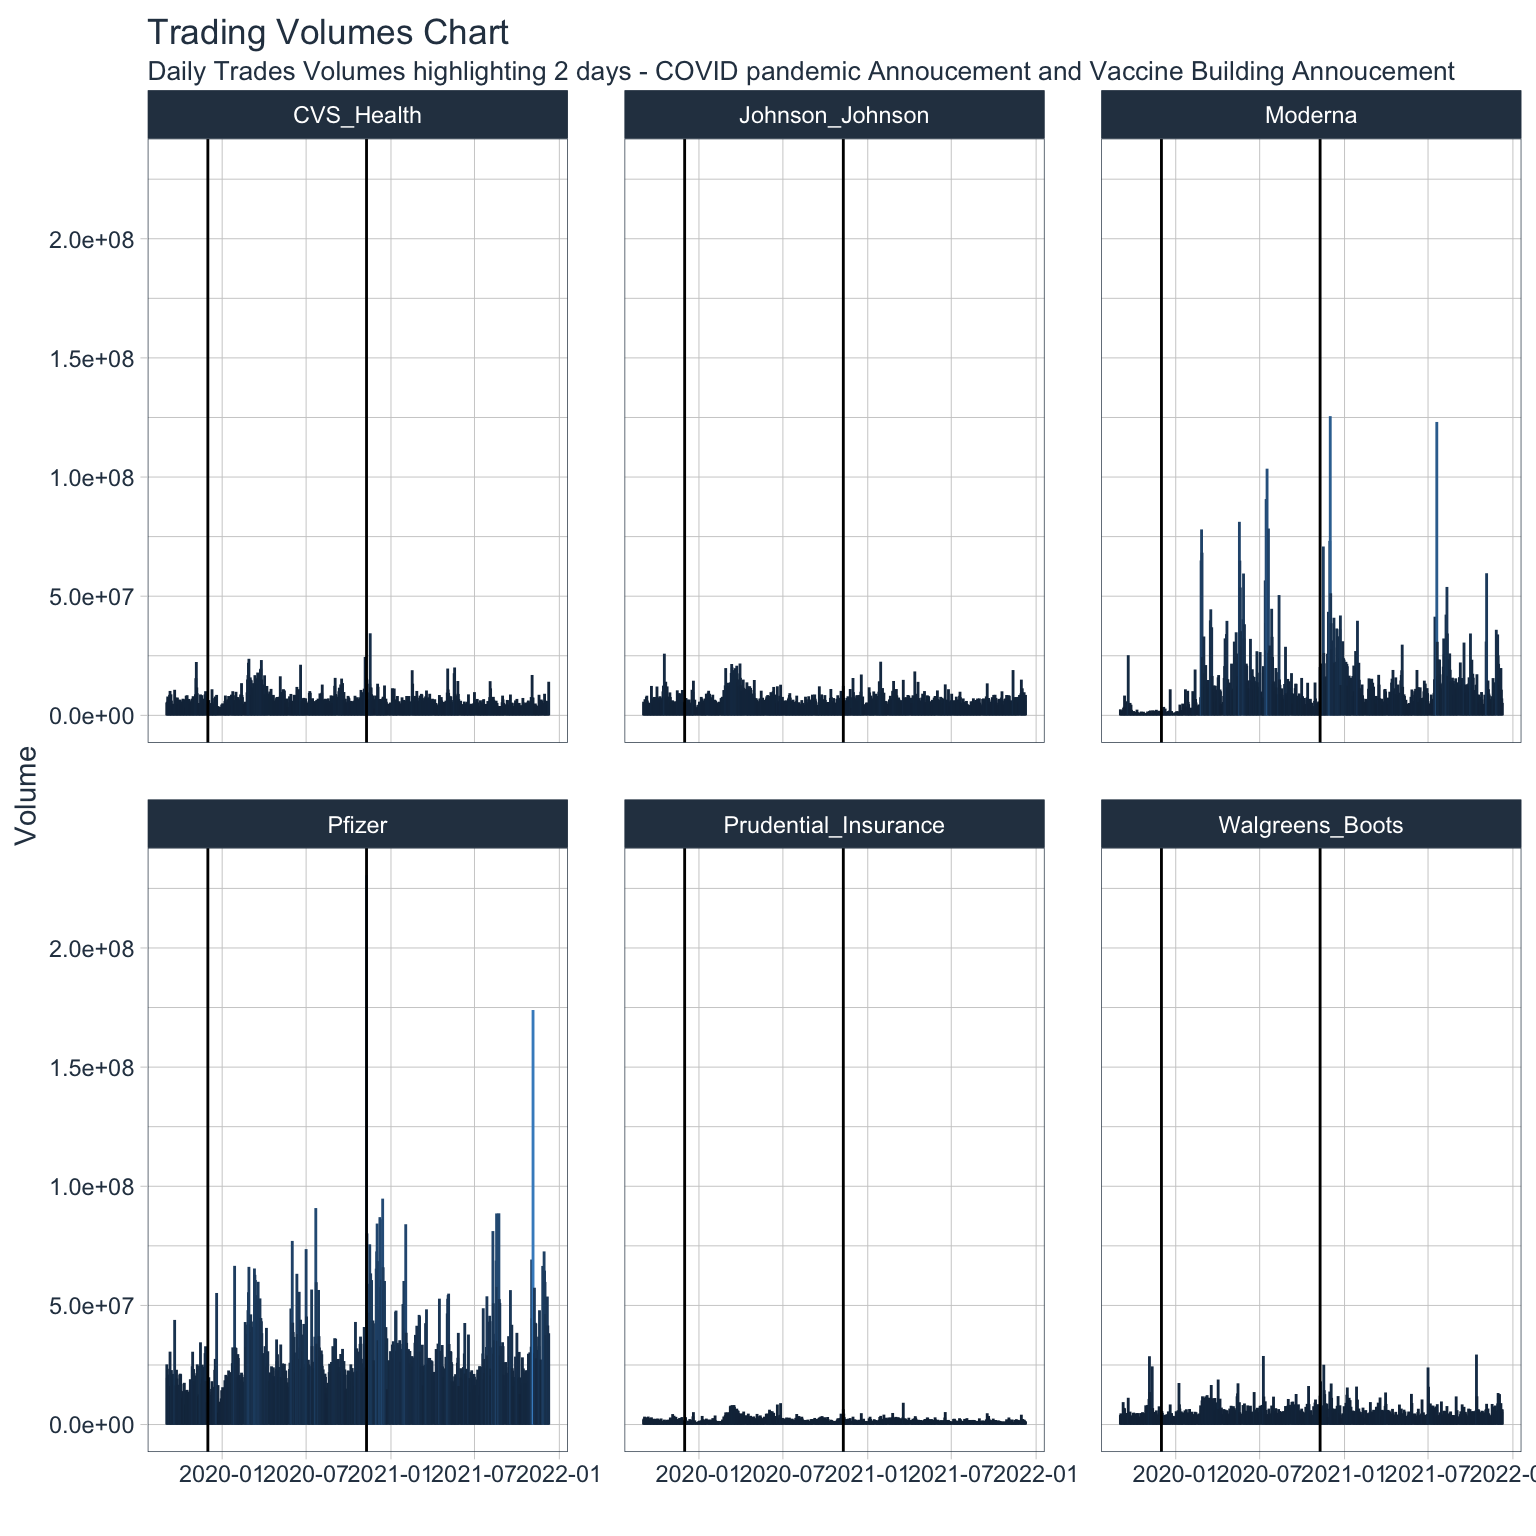
Trading Volumnes through COVID-19
- Pfizer and Moderna are two stocks that saw steep rises during the annoucement of their respective vaccine programs.
- We do not see any other significant movement on other market segments during this time which coincides with the analysis we have done so far.
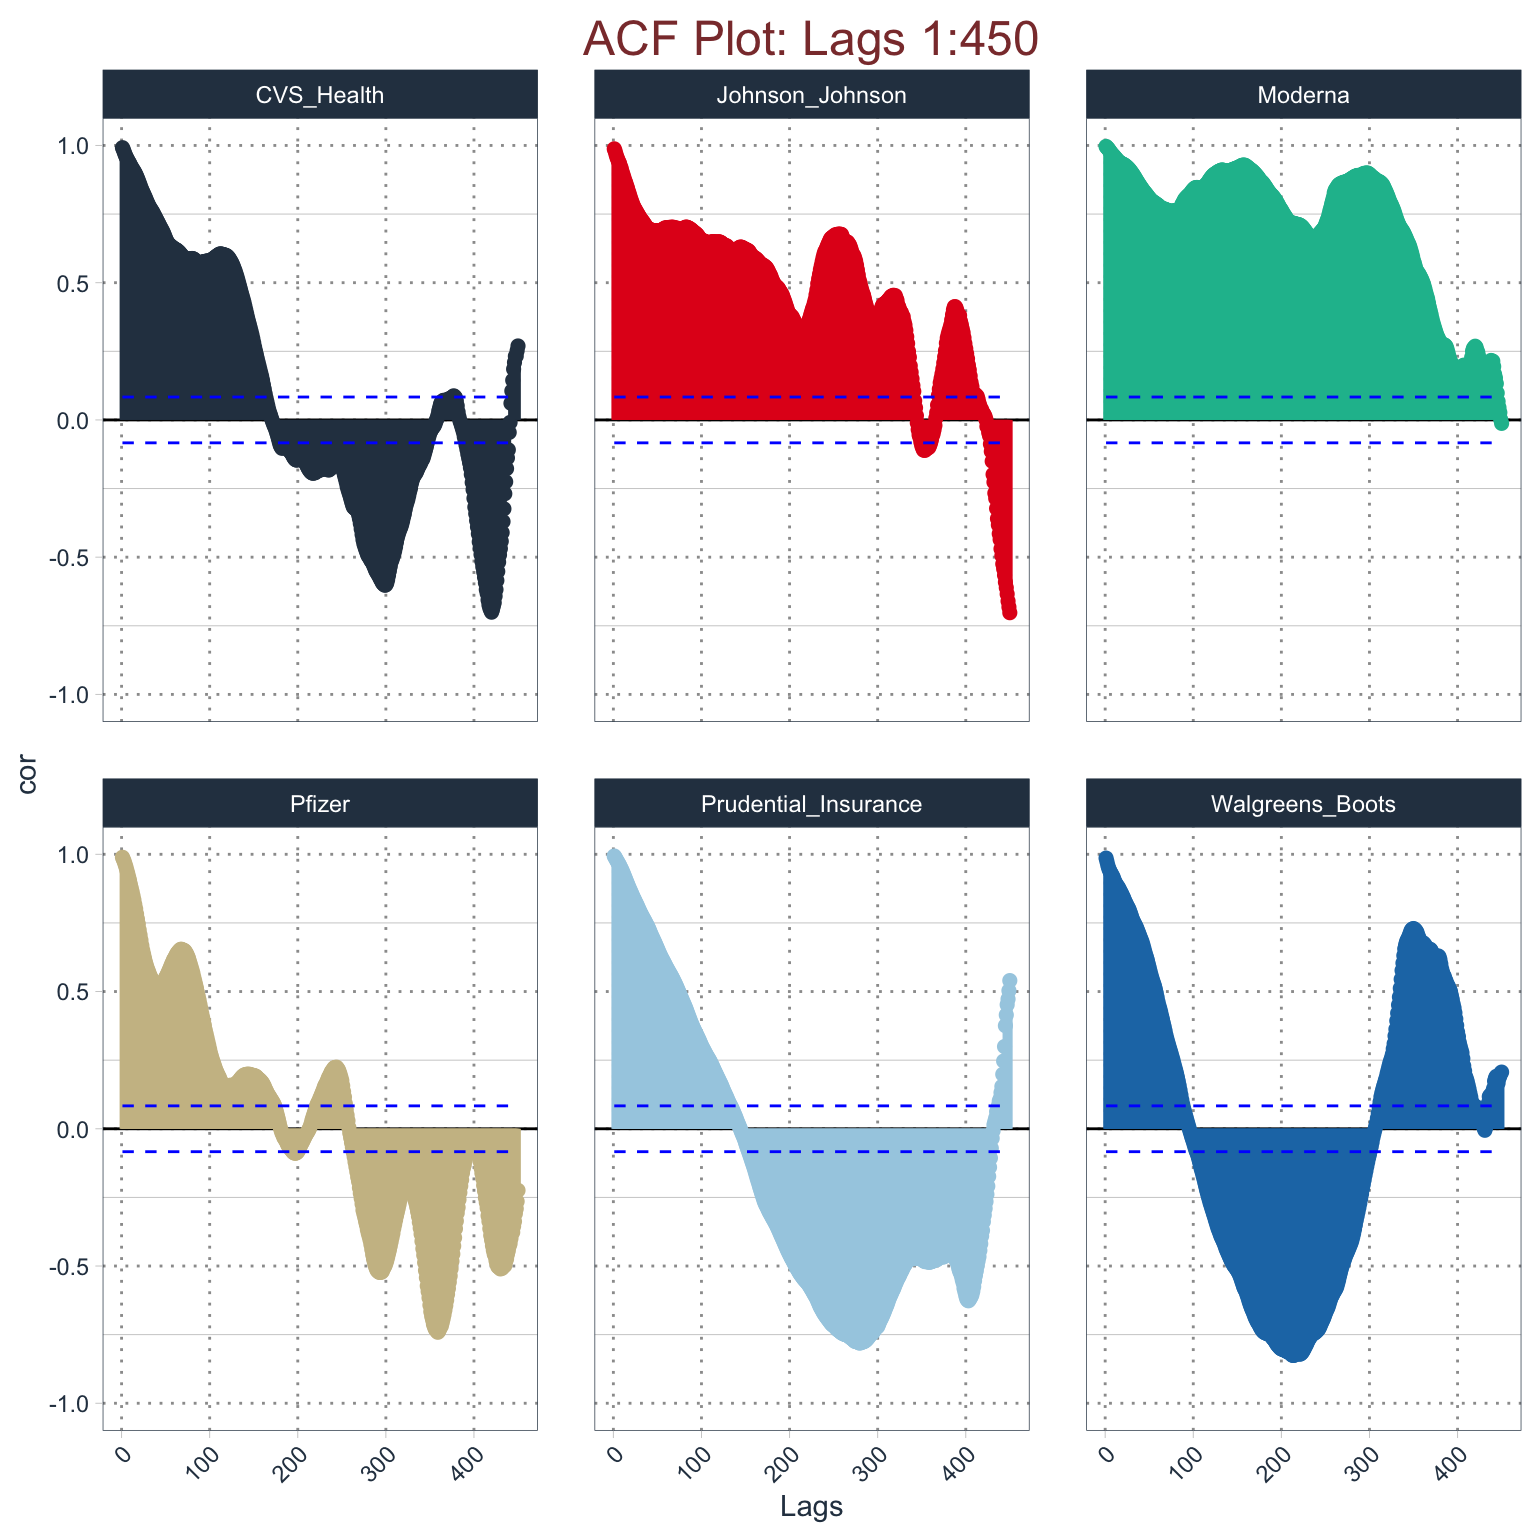
Plotting stock prices against 450 lag orders
- Moderna is one stock that does shows a positive lag order throughout the time series signifying that prices were always unidirectional and were not affected by any of the events we discussed.
- All the other stocks do not show any significant patterns of upward or downward flow.
5.3 Comparison of Vaccine Developing companies against others
- Pfizer (Ticker: PFE)
- BioNTech (Ticker: BNTX)
- Moderna (Ticker: MRNA)
- Johnson & Johnson (Ticker: JNJ)
Comparison against
- S&P 500 (Ticker: ^GSPC)
- Dow Jones Industrial Average (Ticker: ^DJI)
- Nasdaq Composite (Ticker: ^IXIC)
- United Parcel Service (Ticker: UPS)
- Toyota Motor Corporation (Ticker: TM)
Observations from the chart above: - Pfizer, Moderna, Johnson & Johnson and BioNTech were the companies that announced their vaccine development programs early in 2021. - In the period from November 2020 to February 2021, we see a drastic volatility in two of those four stocks, namely, Moderna and BioNTech. - One anticipation for this result might be that BioNTech was actually co-developing the vaccine with Pfizer where Pfizer’s role was to meet with production demands. - Johnson & Johnson was very late to the development and therefore, there is no volatility in it’s stock.
Alphabet reached the lowest point 1056.62 on March 23, 2020. The stock price of Alphabet started to decrease from 1526.69 on February 19 to 1056.62 on March 23, 2020, which is the time when Covid started to increase in the United States, this depicts that the stock price of Alphabet had seen a steep fall in the stock price. While, after March 23, 2020, it started to bounce back and saw an increase. The smoothened version of the Alphabet shows the graph shows a steep increase in the stock price. While other companies like Microsoft, Apple, Adobe, and Oracle are relatively stable haven’t seen much change in the stock price in the specified period above.
As seen earlier in the case of Alphabet, there is a similar kind of trend in the series of Amazon’s stock price as well.
After the fall of Amazon’s stock price, in the span of the pandemic, the increase after mid-March is might be as the Companies started their work remotely, companies had acquired Cloud platforms such as AWS, which might have increased the stock price. Shopify and MercadoLibre had seen less change in the stock price, and as the People started Working from home, the needs had increased and people started to buy items online rather than going to the stores personally, which might be risky in the pandemic situation. So the stock prices have seen a significant increase since April 2020.
Alibaba, Sea although having a low stock price, remained almost the same without much deviation throughout the span irrespective of the covid situation.
As we know, the Covid pandemic badly affected the Courier services initially, Though FedEx is one the major companies in the delivery services. The stock price had seen a steep fall, while compared to other delivery services. On a whole, all the delivery services got impacted initially by the Covid pandemic.
But later, FedEx bounced back to its normal stock price within 2 months might be due to the safety measures they have taken such as sanitizing the goods, which gave hope to people that it is safe enough to get the delivery from the services. After mid-march, FedEx didn’t see the same kind of steep fall that.
It is obvious that in the Month of February, as the Covid cases had increased, people might have thought that this is not the sector in which they should invest, as it would be so unpredictable, and in the month of March and April, there is steep fall for Wizz Air stock price, and then the Airlines started promoting that Airlines are the safest way of transport in the pandemic, as the Airlines are sanitizing the flights with disinfectants, so that covid will not spread across people in their journey. This might be the reason why the Airlines’s stock price bounced back.
Since some countries banned International travel the stock prices also don’t have a clear trend. In this covid pandemic, the Airline stock prices seemed unpredictable.
Chipotle Mexican Grill has seen a steep fall during the first phase of the pandemic, Chipotle Mexican Grill being a more dine-in kind of restaurant rather than take away, the chain faced a steep fall in stock price since people were likely to avoid gathering places like eateries considering the pandemic situation.
While Dominos Pizza had seen an increase in the stock price during this same first phase, opposite to that of happened with Chipotle Mexican Grill. It might be because most people order Dominos Pizza online rather than dining in the Chain. This might be the possible reason that the Dominos stock price did not see a steep fall.
Additionally, the Global presence also might be one of the prominent reasons, Chipotle Mexican Grill being a prominent chain in the United States and some of the European Countries, and has less presence in other countries, the above-mentioned countries being most affected by Covid initially, people weren’t interested in investing in that, while Dominos Pizza being a prominent chain in many countries, the stock prize seemed stable.
5.4 Solving the Problem Statement
- At the start of this analysis, the expectation was that companies involved in some way with the vaccine or health management would have seen a significant rise in stock purchase but that did not happen. The stocks were steady for almost all sectors of the market.
- We saw a rise in investment in the sustainable energy sector which could be an indicator for people’s move towards clean energy as a result of this pandemic.
- Organizations in technology saw a steep rise since the dependence of technology rose significantly through the last two years.