Chapter 2 Data sources
The primary focus of our project is to analyze the sentiment of the US Stock Market. This sentiment largely drives the prices of the stocks we will be analyzing throughout the project. The main sources of our data are Yahoo Finance and Bloomberg Finance. We have used this data in different forms throughout the project. At some places, we have downloaded the processed comma separated files provided by Yahoo Finance for historical data, while at times we have used R packages to directly scrap data from these web pages. The github repository page for this chapter contains the code used.
Primary Data Sources:
The CSV files we are using across this analysis are stored in the data folder of our repository.
2.1 R Packages for Scraping Finance Data
2.1.1 The getSymbols() Function
getSymbols() is a CRAN package function available in Quantmod and is a wrapper to load data from various sources, local or remote. Current src methods available for the getSymbols function are: yahoo, google, MySQL, FRED, csv, RData, oanda, and av. In the example below we would show an example with Yahoo to capture data for Apple’s stock prices.
Below is a sample of the data we get directly using the getSymbols() function for Apple.
| date | AAPL.Open | AAPL.High | AAPL.Low | AAPL.Close | AAPL.Volume | AAPL.Adjusted |
|---|---|---|---|---|---|---|
| 2021-03-01 | 123.75 | 127.93 | 122.79 | 127.79 | 116307900 | 127.1968 |
| 2021-03-02 | 128.41 | 128.72 | 125.01 | 125.12 | 102260900 | 124.5392 |
| 2021-03-03 | 124.81 | 125.71 | 121.84 | 122.06 | 112966300 | 121.4934 |
| 2021-03-04 | 121.75 | 123.60 | 118.62 | 120.13 | 178155000 | 119.5724 |
| 2021-03-05 | 120.98 | 121.94 | 117.57 | 121.42 | 153766600 | 120.8564 |
| 2021-03-08 | 120.93 | 121.00 | 116.21 | 116.36 | 154376600 | 115.8199 |
2.1.2 BatchGetSymbols() Function
Another interesting methodology of capturing data for multiple stocks at once in the BatchGetSymbols() package, made available within the same CRAN package (BatchGetSymbols). It locally stores a downloaded cache of the ticker symbols we call the function with. This data can then be used for analysis locally in the same session. Once the session is reset, we would need to run the code again to rebuild the cache.
After downloading the data, we can check the success of the process for each ticker. Notice that the last ticker does not exist in yahoo finance and therefore results in an error. All information regarding the download process is provided in the dataframe df.control:
| ticker | src | download.status | total.obs | perc.benchmark.dates | threshold.decision |
|---|---|---|---|---|---|
| FB | yahoo | OK | 41 | 1.0000000 | KEEP |
| MMM | yahoo | OK | 41 | 1.0000000 | KEEP |
| PETR4.SA | yahoo | OK | 40 | 0.9512195 | KEEP |
Moreover, this data can now easily be plotted and used for manipulation as well.
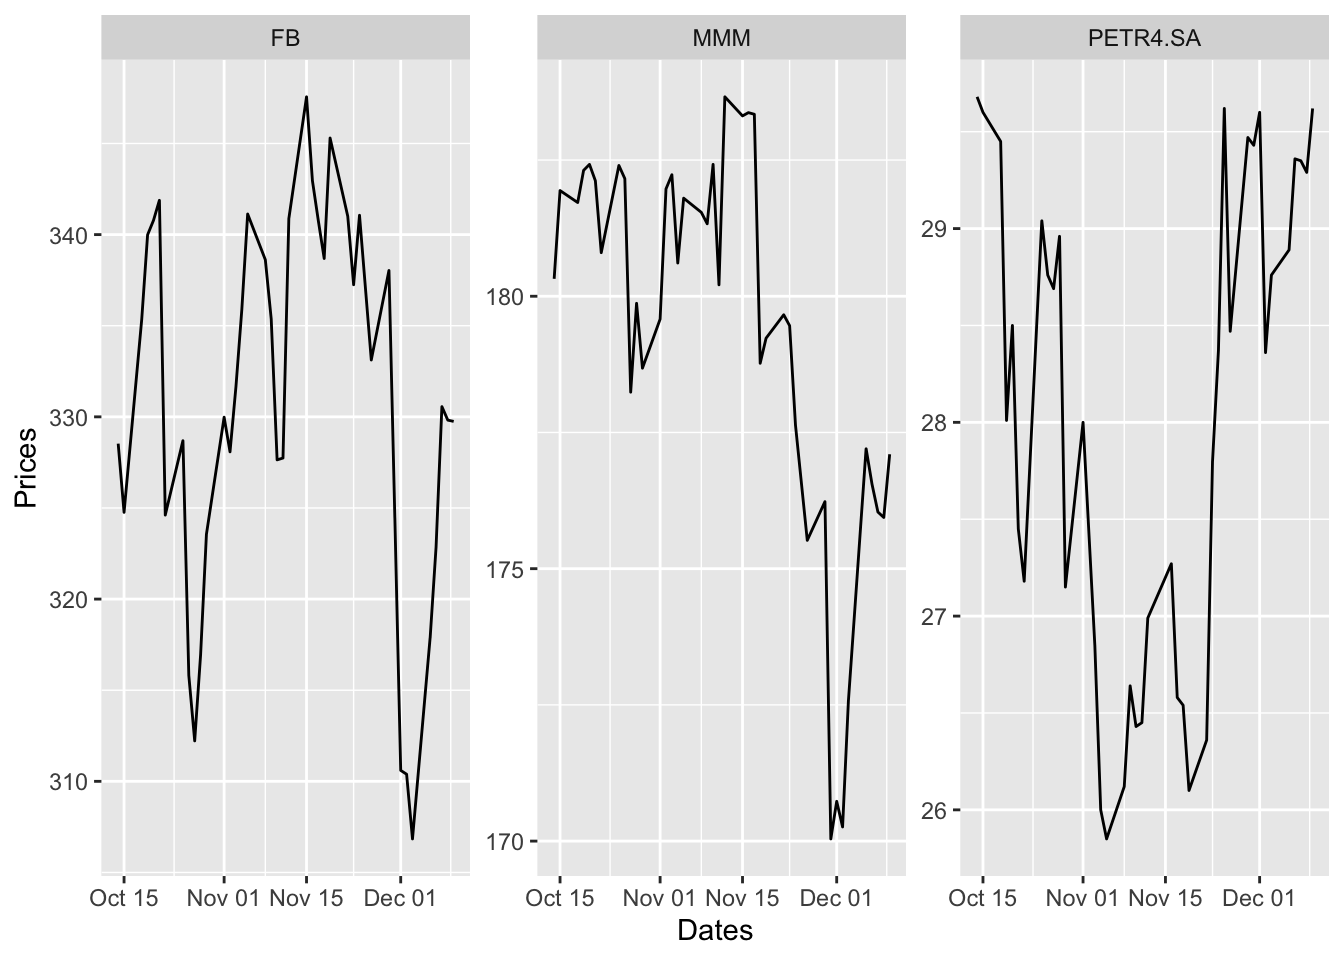
Although this is a neat method to capture data for more then one ticker in the same function the cache functionality makes it difficult to use through multiple sessions. For this reason, we would not be using this method too often. But it is still handy, when one-time stock comparisons are needed (as shown above)
2.2 Structure of input Data
Now, we will glance through the structure of the data we are going to be analyzing. Here, we have used a downloaded CSV file from Yahoo Finance that contains the same data fetched by the getSymbols() package. The downloaded CSV file can be found in the docs section.
| Date | Open | High | Low | Close | Adj Close | Volume |
|---|---|---|---|---|---|---|
| 2021-09-07 | 15375.98 | 15403.44 | 15343.28 | 15374.33 | 15374.33 | 3967040000 |
| 2021-09-08 | 15360.35 | 15360.35 | 15206.61 | 15286.64 | 15286.64 | 4113530000 |
| 2021-09-09 | 15296.06 | 15352.38 | 15245.17 | 15248.25 | 15248.25 | 3997250000 |
| 2021-09-10 | 15332.92 | 15349.47 | 15111.31 | 15115.49 | 15115.49 | 4567980000 |
| 2021-09-13 | 15211.43 | 15215.44 | 15030.85 | 15105.58 | 15105.58 | 4701190000 |
| 2021-09-14 | 15168.45 | 15181.19 | 15008.30 | 15037.76 | 15037.76 | 4571950000 |
We observe that the structure of both data are the same. We would therefore, be using these interchangeably in different scenarios. Structurally, there are no further changes at this point needed to these data sources.